
Why Explainability Matters
Imagine this situation:
Your ML model predicts that a student will fail an exam or a loan will be rejected.
The next question is unavoidable:
Why did the model make this decision?
Accuracy alone is no longer enough.
Modern ML demands interpretability, trust, and accountability.
This is where SHAP (SHapley Additive exPlanations) becomes essential.
SHAP helps us:
-
Explain individual predictions
-
Understand global feature importance
-
Detect bias and leakage
-
Build trustworthy ML systems
What Is SHAP?
SHAP is a model-agnostic explainability technique based on game theory.
Core Idea (Simple Words)
Think of each feature as a player in a game.
-
The game = making a prediction
-
The payout = predicted value
-
Each feature contributes fairly to the final prediction
SHAP calculates how much each feature contributes, positively or negatively.
Why SHAP Is Better Than Traditional Feature Importance
Traditional methods tell you:
-
Which feature is important overall
SHAP tells you:
-
Why THIS prediction happened
-
How much each feature pushed the prediction up or down
-
Direction + magnitude of impact
| Method | Global | Local | Direction | Fair Attribution |
|---|---|---|---|---|
| Coefficients |  |
|
 |
|
| Feature Importance |  |
|
|
|
| SHAP | |
|
|
|
How SHAP Works (Intuition, Not Math)
SHAP values follow 3 important principles:
-
Additivity
All feature contributions add up to the model prediction -
Consistency
If a feature contributes more in a new model, its SHAP value increases -
Fairness
Features are credited based on their true contribution
SHAP Components You Must Understand
 Base Value
-
Average prediction of the model
-
Starting point for explanation
 SHAP Value
-
Contribution of a feature
-
Can be positive or negative
 Final Prediction
Prediction = Base Value + Sum of SHAP Values
Types of SHAP Visualizations


 1. SHAP Summary Plot (Global Explanation)
What it shows:
-
Feature importance across the dataset
-
Distribution of SHAP values
How to read it:
-
Y-axis → Features
-
X-axis → Impact on prediction
-
Color → Feature value (low → high)
Best for overall model behavior
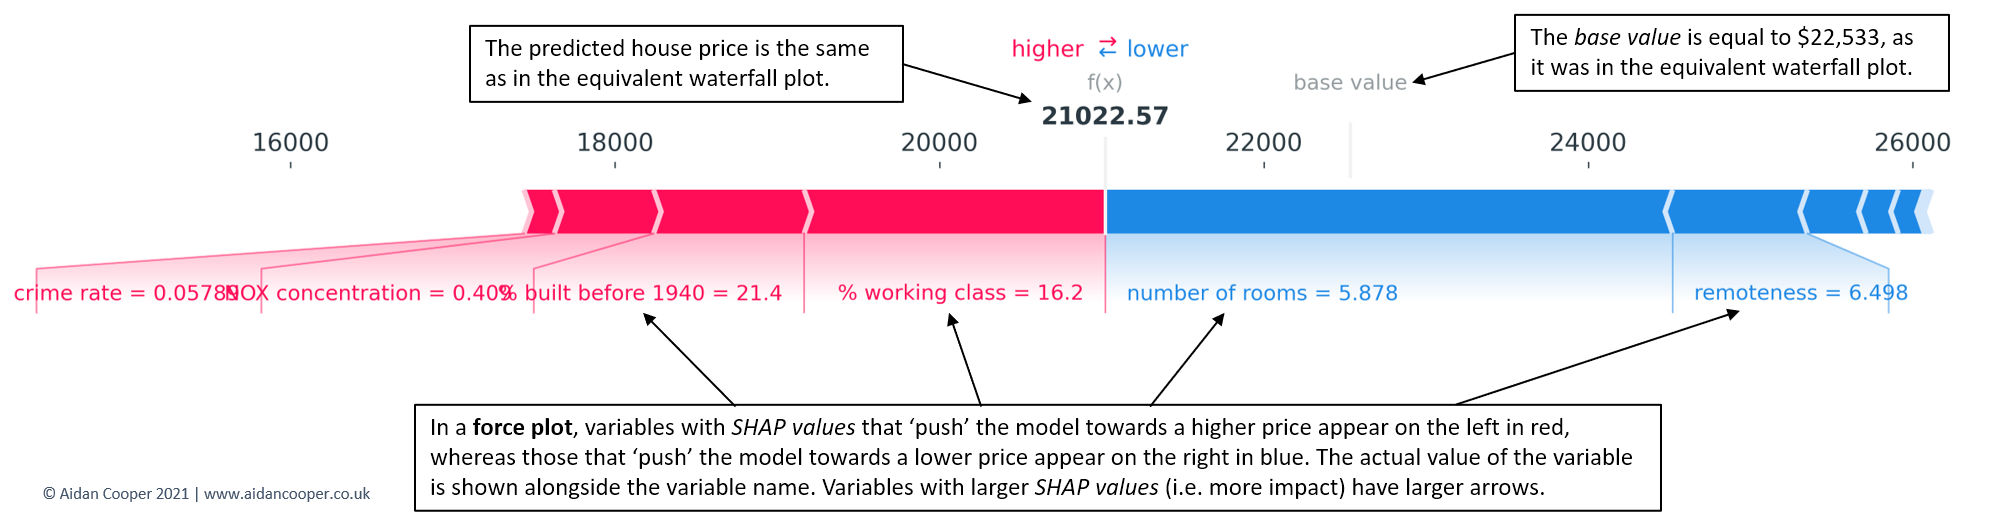
2. SHAP Force Plot (Single Prediction)
What it shows:
-
How each feature pushes the prediction
-
Red → increases prediction
-
Blue → decreases prediction
Best for individual prediction explanation
3. SHAP Waterfall Plot
What it shows:
-
Step-by-step contribution from base value to final output
Perfect for business explanations
4. SHAP Dependence Plot
What it shows:
-
Relationship between feature value and SHAP value
-
Interaction with other features
Great for feature behavior analysis
SHAP with a Practical Example
Example: Predicting Exam Score
Features:
-
Study hours
-
Attendance
-
Sleep hours
-
Previous grades
Model predicts: 78 marks
SHAP explanation:
-
Study hours → +12
-
Attendance → +8
-
Sleep hours → −4
-
Previous grades → +6
 Interpretation:
Low sleep reduced performance despite good preparation.
SHAP Example Code (Student-Friendly)
import shap
import xgboost as xgb

# Train model
model = xgb.XGBRegressor()
model.fit(X_train, y_train)

# Create SHAP explainer
explainer = shap.Explainer(model)
shap_values = explainer(X_test)

# Summary plot
shap.summary_plot(shap_values, X_test)

# Force plot for one prediction
shap.force_plot(
    explainer.expected_value,
    shap_values[0].values,
    X_test.iloc[0]
)
SHAP for Model Evaluation (Not Just Explainability)
SHAP helps you evaluate model quality by answering:
-
Is the model using logical features?
-
Is there data leakage?
-
Are predictions biased?
-
Is the model over-relying on one feature?
If SHAP explanations don’t make sense → model is wrong, not the data.
Common Mistakes Students Make with SHAP
Interpreting SHAP values as probabilities Ignoring feature correlation Using SHAP plots without domain understanding Explaining only one prediction, not global behavior
When Should You Teach / Use SHAP?
 After model training Before deploying to production During debugging For interviews For regulatory or business reporting
SHAP in Interviews (Very Important!)
Interviewers love questions like:
-
How do you explain a black-box model?
-
How do you detect bias in ML models?
SHAP is a strong, practical answer.
A model you cannot explain is a model you cannot trust.
SHAP turns ML models from black boxes into glass boxes.
If you’re learning Machine Learning seriously:
-
Accuracy tells how good your model is
-
SHAP tells why it behaves that way And why always matters.